Over the past few months, I completed the Google Data Analytics Professional Certificate on Coursera, where I learned how to approach data problems using the six-step analysis process: Ask, Prepare, Process, Analyze, Share, and Act.
I also acquired analytical technical skills, including SQL, R programming, Tableau, and spreadsheet-based tools, which are necessary to conduct the process.
To apply these skills in a real-world case, I chose to work on the Cyclistic Case Study as my Capstone Project. This project enabled me to figure out rider behaviors using a full year of 2024 bike-share data and translate the findings into actionable insights that support business decision-making.
- Scenario
- Ask
- Prepare
- Process
- 1. Ensuring there is no duplicate data
- 2. Cleaning the Trip Data
- 3. Combining All Cleaned Monthly Datasets (January–December 2024)
- Analyze
- 1. Total Rides per User Type
- 2. Average Ride Length per User Type
- 3. Number of Rides by Day of Week per User Type
- 4. Rides by Bike Type
- 5. Most Popular Start Stations per User Type
- 6. Most Popular Routes per User Type
- 7. Ride Frequency by Month per User Type
- Data Limitation
- Share
- Summary of Key Findings
- Act: Top Three Recommendations
- 1. Offer Flexible Membership Options
- 2. Promote Electric-Bike Benefits Through Targeted Digital Campaigns
- 3. Use Personalized Nudges Based on Riding Patterns
- Closing
Scenario
In this case study, I’m taking on the role of a Junior Data Analyst at Cyclistic, a bike-sharing program operating in Chicago, providing thousands of classic and electric bikes across an extensive network of docking stations throughout the city.
There are two types of customers: casual riders, who purchase single-ride or day passes, and annual members, who subscribe to a yearly plan. The company’s leadership aims to understand the differences in riding behavior between these two groups and to develop strategies to increase membership.
Ask
Cyclistic’s marketing team aims to increase the number of annual members because they generate more long-term revenue than casual riders, increasing the company’s profit.
To support this goal, I have been tasked with answering the question: “How do annual members and casual riders use Cyclistic bikes differently?”
By identifying key usage patterns between the two rider groups, the insights from this analysis will help the marketing department design targeted strategies and digital campaigns that encourage more casual riders to convert into annual members.
The key stakeholders for this task include the director of marketing, the Cyclistic executive team, and the marketing analytics team.
Prepare
To complete the project, I utilized the most recent historical Cyclistic bike trip data from 2024, spanning 12 months.
For this analysis, I have downloaded and organized the data as monthly CSV files with consistent column structures across all tables, making it suitable for merging and analysis.
Because the dataset is large, I use SQL (BigQuery) to clean, combine, and assess the data’s integrity, and Tableau to visualize the results.
The data also contains no personally identifiable information, which meets the privacy requirements and can be analyzed safely.
Overall, these data sources provide sufficient detail to answer the business question about how different rider types use Cyclistic bikes.
Process
Before conducting any analysis, it is essential to ensure the dataset is clean and reliable.
I cleaned each monthly dataset individually before combining them to ensure consistent data quality across all files, as it’s easier to detect issues.
This approach also simplifies troubleshooting (if any) and ensures that all months follow the same structure before merging.
1. Ensuring there is no duplicate data
#1 The total number of ride_id
The primary key of the Cyclistic dataset is ride_id, which means each ride should have a unique ID. If there are duplicated ride_id values, it indicates data integrity issues such as double-recording or erroneous entries.
To confirm that the dataset does not contain duplicates, I performed a validation check on the ride_id column.
The first step is to count how many ride records exist in the dataset:
SELECT
 COUNT(ride_id) AS total_rides
 FROM `totemic-fulcrum-425209-m7.cyclistic_project.012024_tripdata`
The result is there are 144873 total rides.
Next, I count how many unique ride IDs exist:
SELECT
 DISTINCT COUNT(ride_id) AS distinct_rides
 FROM `totemic-fulcrum-425209-m7.cyclistic_project.012024_tripdata`
The result shows that both counts are identical, which means:
- There are no duplicate ride_id values
- Each trip is uniquely recorded
- The primary key is valid and the dataset passes this integrity check
#2 The member_casual column
Before moving forward with the analysis, I verified the values contained in the member_casual column. This field indicates the type of rider for each trip, and according to Cyclistic’s system, it should only contain two categories:
- Member: annual subscribers
- Casual: non-subscribers or single-ride/day-pass users
To confirm that the dataset does not contain unexpected or incorrect labels, I ran the following query:
SELECT
 DISTINCT member_casual AS member_casual_total
 FROM `totemic-fulcrum-425209-m7.cyclistic_project.012024_tripdata`
This query returns all unique values present in the member_casual column. The result showed exactly two values: “member” (represents annual members) and “casual” (represents casual riders) , indicating that the data is clean and consistently categorized.
2. Cleaning the Trip Data
To prepare the dataset for analysis, I created a cleaned version of each month table. This query performs several important cleaning steps, including removing invalid records and creating new variables that will be useful during analysis.
CREATE OR REPLACE TABLE `totemic-fulcrum-425209-m7.cyclistic_project.012024_tripdata_clean`
AS
SELECT
  *,
  ended_at - started_at AS ride_length,
  FORMAT_TIMESTAMP('%A', started_at) AS day_of_week_name
FROM `totemic-fulcrum-425209-m7.cyclistic_project.012024_tripdata`
WHERE started_at IS NOT NULL
  AND ended_at IS NOT NULL
  AND TIMESTAMP_DIFF(ended_at, started_at, SECOND) > 0
  AND TIMESTAMP_DIFF(ended_at, started_at, HOUR) < 24;
What this query does:
#1 Creates or replaces a cleaned table
CREATE OR REPLACE TABLE ...
#2 Selects all existing columns
SELECT *
This keeps all the original fields from the raw dataset.
#3 Creates a new ride_length column
ended_at - started_at AS ride_length
I created the ride_length column to calculate the duration of each trip, which is one of the most critical metrics in the Cyclistic case study.
Understanding how long riders use the bikes helps reveal behavioral differences between members and casual riders.
#4 Coverts the weekday into a readable name
FORMAT_TIMESTAMP('%A', started_at) AS day_of_week_name
Instead of storing weekdays as numbers (1–7), this converts them into actual day names such as Monday, Tuesday, and so on, making it more intuitive.
#5 Filters out invalid or unrealistic records
The WHERE clause ensures only clean, valid trip data is included.
WHERE started_at IS NOT NULL
  AND ended_at IS NOT NULL
  AND TIMESTAMP_DIFF(ended_at, started_at, SECOND) > 0
  AND TIMESTAMP_DIFF(ended_at, started_at, HOUR) < 24;
started_at IS NOT NULLandended_at IS NOT NULLensure all trips have valid timestamps.TIMESTAMP_DIFF(..., SECOND) > 0removes trips with negative or zero duration, which are data errors.TIMESTAMP_DIFF(..., HOUR) < 24filters out rides longer than 24 hours, which are typically unrealistic or system glitches.
Final Result
After running this query, the resulting table:
- contains no missing timestamps
- contains only realistic, valid trip durations
- includes a clean
ride_lengthfield - includes a descriptive
day_of_week_namecolumn - is ready for exploration and analysis
After validating and cleaning the January 2024 dataset, I applied the exact same cleaning process to the remaining monthly datasets (February–December 2024).
By standardizing the cleaning workflow across all 12 months, the combined full-year dataset becomes reliable, uniform, and ready for deeper analysis and visualization.
3. Combining All Cleaned Monthly Datasets (January–December 2024)
After cleaning each monthly dataset individually, the next step was to combine all twelve months into a single, full-year dataset.
I used UNION ALL to merge the tables, which ensures that every record is included without removing legitimate entries.
CREATE OR REPLACE TABLE `totemic-fulcrum-425209-m7.cyclistic_project.2024_fullyear_clean` AS
SELECT * FROM `totemic-fulcrum-425209-m7.cyclistic_project.012024_tripdata_clean`
UNION ALL
SELECT * FROM `totemic-fulcrum-425209-m7.cyclistic_project.022024_tripdata_clean`
UNION ALL
SELECT * FROM `totemic-fulcrum-425209-m7.cyclistic_project.032024_tripdata_clean`
UNION ALL
SELECT * FROM `totemic-fulcrum-425209-m7.cyclistic_project.042024_tripdata_clean`
UNION ALL
SELECT * FROM `totemic-fulcrum-425209-m7.cyclistic_project.052024_tripdata_clean`
UNION ALL
SELECT * FROM `totemic-fulcrum-425209-m7.cyclistic_project.062024_tripdata_clean`
UNION ALL
SELECT * FROM `totemic-fulcrum-425209-m7.cyclistic_project.072024_tripdata_clean`
UNION ALL
SELECT * FROM `totemic-fulcrum-425209-m7.cyclistic_project.082024_tripdata_clean`
UNION ALL
SELECT * FROM `totemic-fulcrum-425209-m7.cyclistic_project.092024_tripdata_clean`
UNION ALL
SELECT * FROM `totemic-fulcrum-425209-m7.cyclistic_project.102024_tripdata_clean`
UNION ALL
SELECT * FROM `totemic-fulcrum-425209-m7.cyclistic_project.112024_tripdata_clean`
UNION ALL
SELECT * FROM `totemic-fulcrum-425209-m7.cyclistic_project.122024_tripdata_clean`;
Analyze
After cleaning and combining all 2024 Cyclistic trip data in BigQuery, I conducted descriptive analysis using SQL to calculate key metrics and identify usage patterns. At this stage, the goal is to analyze the data and address the key business questions:
- How do annual members and casual riders use Cyclistic bikes differently?
- Why would casual riders consider purchasing Cyclistic annual memberships?
- How can Cyclistic use digital media to encourage casual riders to become members?
To answer these questions, I developed several points of analysis that highlight differences in behavior, usage trends, and opportunities for targeted marketing strategies.
1. Total Rides per User Type
This analysis shows the overall number of rides taken by each user type throughout the year. It helps establish the basic distribution of Cyclistic users and reveals which group uses the service more frequently.
SELECT
  member_casual,
  COUNT(*) AS total_rides
FROM `totemic-fulcrum-425209-m7.cyclistic_project.2024_fullyear_clean`
GROUP BY member_casual;
2. Average Ride Length per User Type
Here, I compare the average duration of trips between members and casual riders to find out a fundamental behavioral difference between casual and member riders.
SELECT
  member_casual,
  AVG(TIMESTAMP_DIFF(ended_at, started_at, MINUTE)) AS avg_ride_length_minutes
FROM `totemic-fulcrum-425209-m7.cyclistic_project.2024_full_year_clean`
GROUP BY member_casual;
3. Number of Rides by Day of Week per User Type
This analysis will examine weekly usage patterns by distinguishing between member and casual activity. It helps explain when each group prefers to ride, whether they ride mostly for commuting or weekend leisure.
#1 Member
SELECT
  day_of_week_name,
  COUNT(*) AS total_rides
FROM `totemic-fulcrum-425209-m7.cyclistic_project.2024_full_year_clean`
WHERE member_casual = 'member'
GROUP BY day_of_week_name
ORDER BY total_rides DESC;
#2 Casual
SELECT
  day_of_week_name,
  COUNT(*) AS total_rides
FROM `totemic-fulcrum-425209-m7.cyclistic_project.2024_full_year_clean`
WHERE member_casual = 'casual'
GROUP BY day_of_week_name
ORDER BY total_rides DESC;
4. Rides by Bike Type
This section will identify the types of bikes: classic, electric, or docked — that are used most frequently. It will provide insight into user preferences and can inform resource allocation and marketing strategies.
SELECT
  rideable_type,
  COUNT(*) AS total_rides
FROM `totemic-fulcrum-425209-m7.cyclistic_project.2024_full_year_clean`
GROUP BY rideable_type
ORDER BY total_rides DESC;
5. Most Popular Start Stations per User Type
With this analysis, I want to identify the typical starting points for each user group. It will help me reveal geographic behavior.
#1 Member
SELECT
  member_casual,
  start_station_name,
  COUNT(*) AS total_rides
FROM `totemic-fulcrum-425209-m7.cyclistic_project.2024_fullyear_clean`
WHERE start_station_name IS NOT NULL
  AND member_casual = 'member'
GROUP BY member_casual, start_station_name
ORDER BY total_rides DESC;
Even though the dataset has already been cleaned, I still excluded rows with missing station names when analyzing station popularity. This is because NULL station values are not errors. They naturally occur due to the use of dockless rides.
This query also applies to the following analysis.
#Casual
SELECT
  member_casual,
  start_station_name,
  COUNT(*) AS total_rides
FROM `totemic-fulcrum-425209-m7.cyclistic_project.2024_fullyear_clean`
WHERE start_station_name IS NOT NULL
  AND member_casual = 'casual'
GROUP BY member_casual, start_station_name
ORDER BY total_rides DESC;
6. Most Popular Routes per User Type
At this point, I take it a step further by analyzing full routes (including both start and end points).
It indicates whether riders are using bikes for point-to-point travel or for recreational loops that start and end at the same station, which is ubiquitous among casual riders in tourist areas.
#1 Member
SELECT
  start_station_name,
  end_station_name,
  COUNT(*) AS total_rides
FROM `totemic-fulcrum-425209-m7.cyclistic_project.2024_fullyear_clean`
WHERE member_casual = 'member'
  AND start_station_name IS NOT NULL
  AND end_station_name IS NOT NULL
GROUP BY start_station_name, end_station_name
ORDER BY total_rides DESC;
#2 Casual
SELECT
  start_station_name,
  end_station_name,
  COUNT(*) AS total_rides
FROM `totemic-fulcrum-425209-m7.cyclistic_project.2024_fullyear_clean`
WHERE member_casual = 'casual'
  AND start_station_name IS NOT NULL
  AND end_station_name IS NOT NULL
GROUP BY start_station_name, end_station_name
ORDER BY total_rides DESC;
7. Ride Frequency by Month per User Type
This analysis examines seasonal trends across the year.
#1 Member
SELECT
  FORMAT_TIMESTAMP('%b', started_at) AS month_name,
  member_casual,
  COUNT(*) AS total_rides
FROM `totemic-fulcrum-425209-m7.cyclistic_project.2024_fullyear_clean`
WHERE member_casual = 'member'
GROUP BY month_name, member_casual
ORDER BY total_rides DESC;
#2 Casual
SELECT
  FORMAT_TIMESTAMP('%b', started_at) AS month_name,
  member_casual,
  COUNT(*) AS total_rides
FROM `totemic-fulcrum-425209-m7.cyclistic_project.2024_fullyear_clean`
WHERE member_casual = 'casual'
GROUP BY month_name, member_casual
ORDER BY total_rides DESC;
Data Limitation
As the Cyclistic dataset I used does not provide gender information, I was unable to perform a gender-based analysis.
Initially, I planned to analyze whether gender affects the usage of bike share, which could have provided valuable insights for both operational and marketing purposes. If gender data were available and female users were shown to be underrepresented, I would have examined two areas:
- Operations: ensuring that bike design and station environments are safe and comfortable for women riders.
- Marketing: developing marketing campaigns to encourage bike-share adoption within girls’ and women’s communities.
Share
After completing the analysis, I proceeded to the visualization stage to effectively communicate the insights.
Using Tableau, I converted the SQL outputs into intuitive charts and maps that illustrate how different rider groups use Cyclistic bikes. These visuals make the patterns easier to understand and support the recommendations that follow.
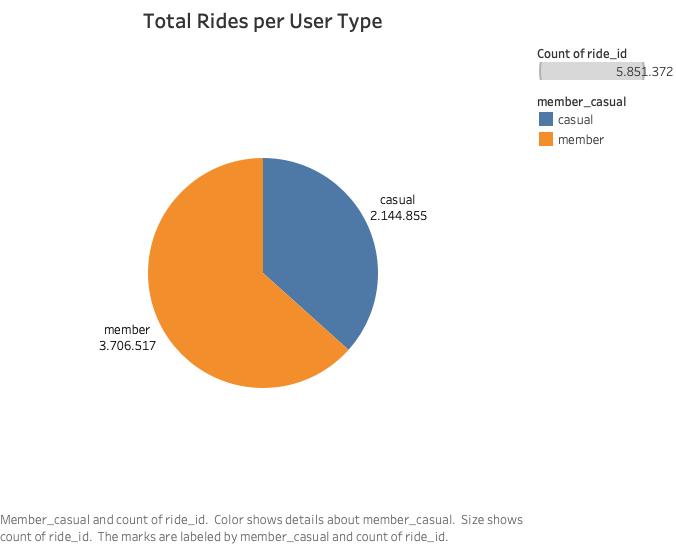
The pie chart shows a clear imbalance in the usage of Cyclistic bikes in 2024. Annual members logged roughly 3.7 million rides, while casual riders logged only about 2.1 million.
Although Chicago attracts a large number of tourists, casual riders still make up a smaller portion of total rides. This suggests that Cyclistic’s core usage is driven by locals who rely on the service for regular, everyday travel, not just weekend outings or sightseeing.
The size of the member segment also signals something important for marketing: once riders become members, they use the system far more frequently than casual users.
This is a strong indicator that converting casual riders into members could meaningfully increase overall ridership and revenue, because the data shows that membership changes user behavior, not just user status.
Next, I selected the most popular start stations among both casual and member riders to conduct a more in-depth analysis.
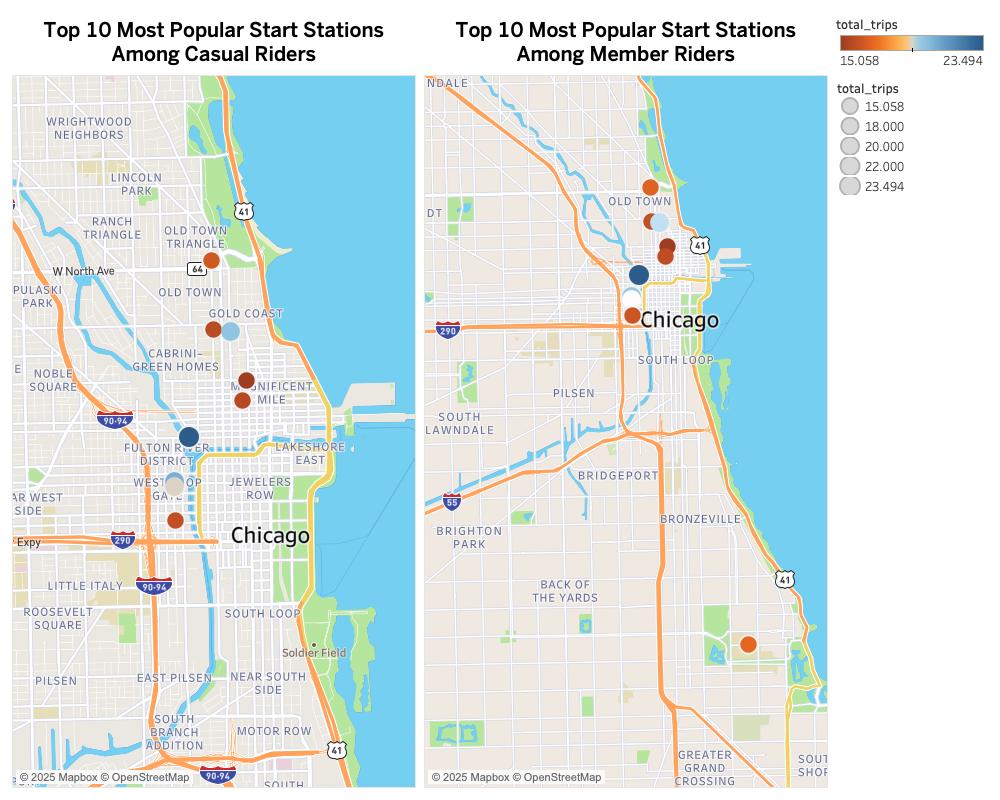
The results highlight contrasting behavioral patterns between the two groups. Casual riders’ most popular start stations are concentrated in Chicago’s major tourist areas, such as Streeter Dr & Grand Ave (Navy Pier), Millennium Park, DuSable Lake Shore Drive, and Montrose Harbor.
These areas are scenic and designed for leisure. This finding convinces me that most casual riders are tourists or occasional riders who want to explore the lakefront and downtown attractions.
On the other hand, the most popular start stations for member riders are concentrated near residential zones, university campuses, and office districts, such as River North, West Loop, and the University of Chicago.
This distribution reveals a strong commuting pattern, indicating that members utilize the bike share system as part of their daily mobility routines.
Then, I was intrigued to find the most popular routes among casual riders to explore more detailed information about their usage behavior.
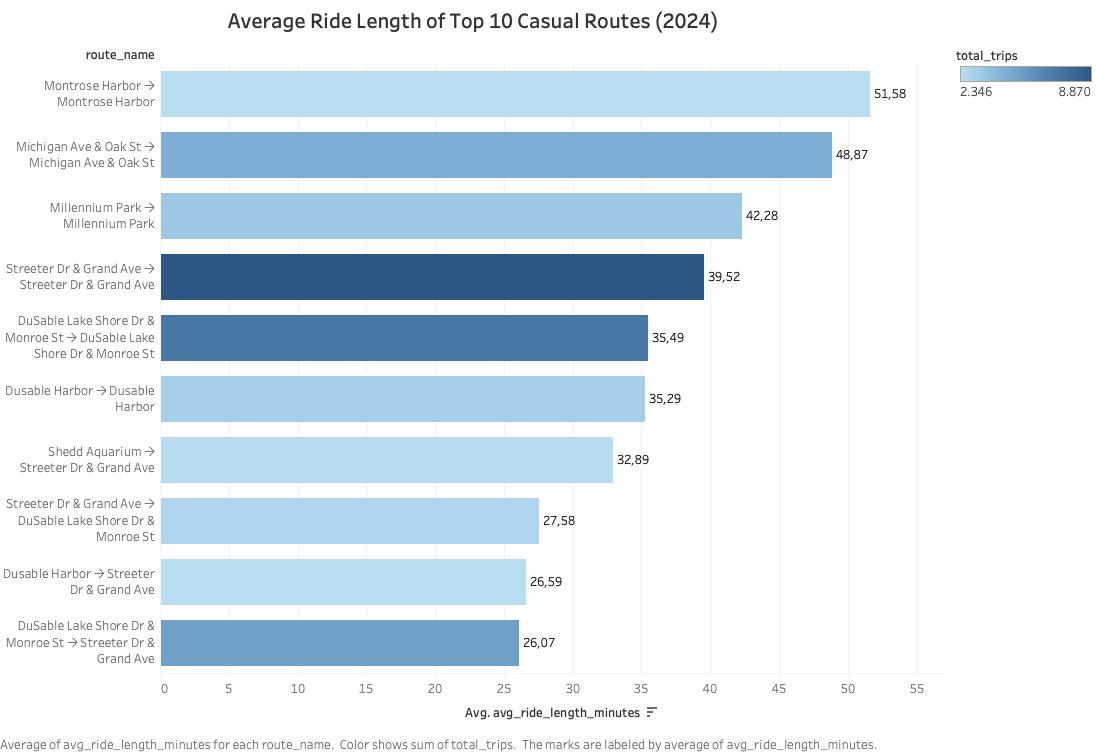
The results show that many of the top casual routes start and end at the same station, such as Montrose Harbor → Montrose Harbor or Millennium Park → Millennium Park.
This strongly indicates that casual riders are not traveling to a destination but are using the bikes for sightseeing loops, recreation, and leisurely exploring the waterfront.
These routes also have significantly longer ride durations, often between 30–50 minutes, showing that casual riders spend extended, uninterrupted time cycling in visually appealing areas rather than using the bikes for transportation.
From this analysis, we can conclude that while member riders primarily use Cyclistic bikes for commuting, casual riders use them for leisure, recreation, and tourism, distinct usage patterns that should inform Cyclistic’s marketing and membership strategies.
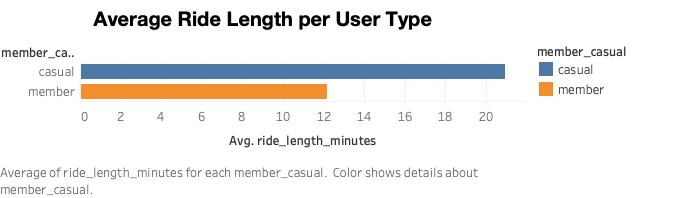
The result of the average ride-length chart below reinforces the fact that casual riders use the bike share longer than member riders, indicating underlying needs, and they are most likely willing to convert into member riders for cost savings and access to premium features.
Now, let’s review how the behaviors of casual and member riders vary according to their ride frequency by day and month.
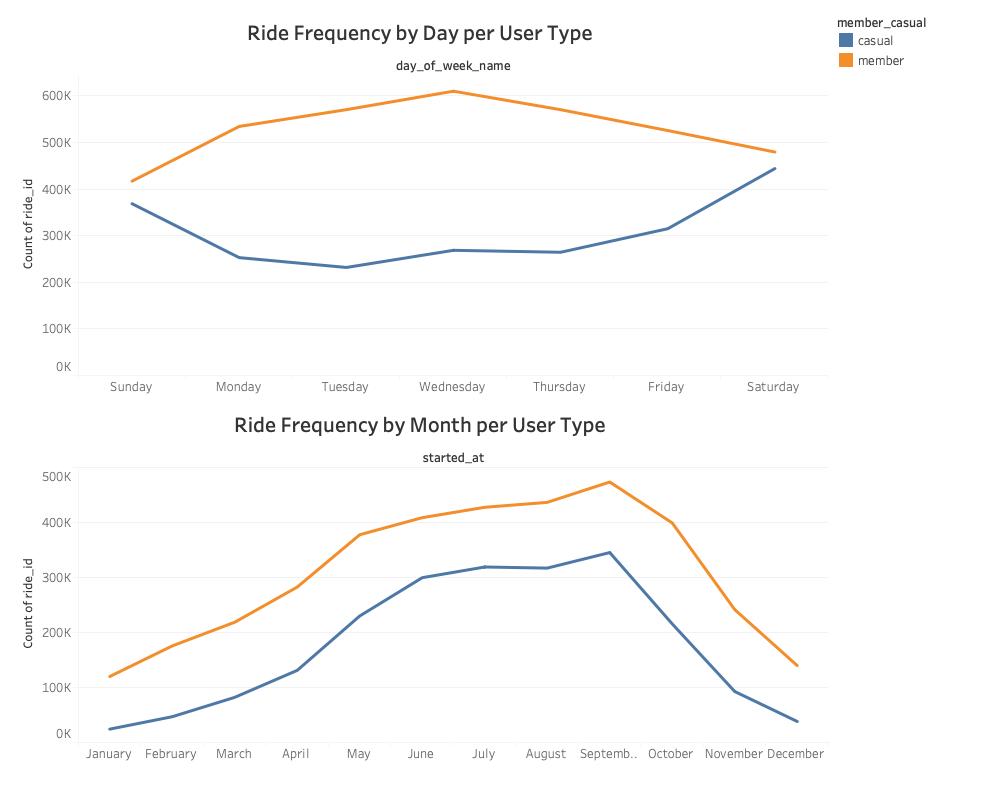
The day-of-week chart shows a clear pattern that casual riders mostly ride on weekends, while member riders consistently ride on weekdays. This aligns with the earlier findings that members ride for commuting, and casual riders for leisure activities.
Next, the month-by-month trend hints at a strong seasonal pattern. Casual riders are highly active from May to September, which is associated with Chicago’s spring and summer seasons.
The characteristics of warmer weather and longer daylight hours increase tourism. However, their usage drops sharply from November to April, when winter conditions make biking less appealing. Members also decline in winter, but to a lesser extent.
These patterns suggest that offering seasonal or summer-focused membership plans could be far more appealing to casual riders, as their peak demand typically occurs only during the warm months.
Turning this seasonal behavior into a structured membership product could significantly increase conversions.
Last but not least, to better understand how to encourage casual riders to become members, we need to examine the types of bikes they prefer.
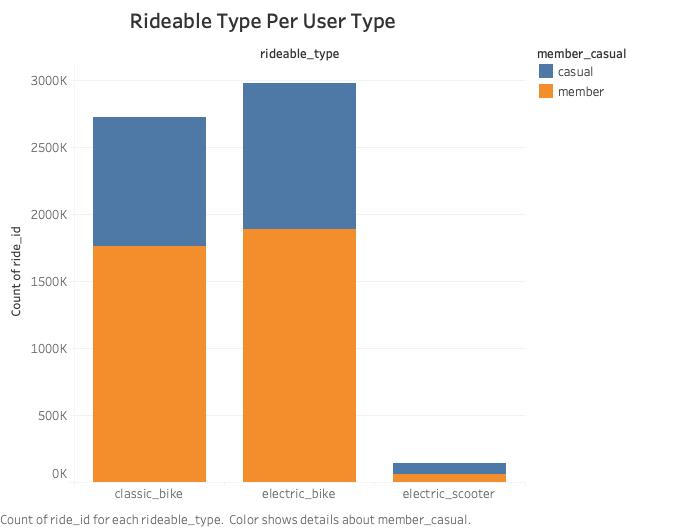
The bar chart shows that casual riders use electric bikes slightly more often than classic bikes, while member riders use both types at relatively similar proportions. Although the gap between bike types isn’t significant, the preference still makes sense.
As casual riders tend to take longer, continuous trips without stopping, they need electric bikes, which offer a smoother and less physically demanding experience, making them more appealing for these leisure-focused journeys.
This insight suggests that any membership strategy targeting casual riders should emphasize the value and convenience of electric-bike access.
Summary of Key Findings
- Members ride significantly more than casual riders.
- Casual riders behave like tourists or leisure users, whereas Members primarily use Cyclistic for commuting.
- Casual riders take much longer trips than members.
- Strong seasonal pattern among casual riders.
- Electric bikes are slightly more popular among casual riders.
Act: Top Three Recommendations

Here are Three Clear, Insight-Driven Recommendations based on my analysis and directly addressing the company goals:
1. Offer Flexible Membership Options
As casual riders are heavy users during spring and summer and tend to ride for longer durations (especially around tourist and recreational areas), they do need the service, but not consistently throughout the year.
Offering an annual membership wouldn’t fit their needs and would not be worthwhile.
Instead, Cyclistic can offer other membership models that are more relevant to their natural behavior, such as seasonal and short-term memberships, like summer passes or weekend-only memberships. So that they can save money during the months they ride the most, without committing to a full year.
2. Promote Electric-Bike Benefits Through Targeted Digital Campaigns
Casual riders show a notable preference for electric bikes — likely because they take longer leisure rides without frequent stops. Cyclistic can use this insight to create digital campaigns that highlight unlimited or discounted e-bike usage for members.
We should deliver campaign messages through platforms that casual riders already use while exploring the city, such as Google Maps ads, Instagram Reels, TikTok, and location-based promotions around major tourist attractions.
Not only can we utilize digital marketing ads, but we can also collaborate with digital influencers who specialize in travel niches to promote the benefits of membership.
For example, we can ask them to create personal-based experience short videos about enjoying the lakefront using Cyclistic bike shares and how it can result in smoother rides and faster travel times for long tourist routes, promoting quick recovery in such a hectic modern life.
3. Use Personalized Nudges Based on Riding Patterns
The following recommendation is to maximize the campaigns by sending the casual riders personalized reminder emails that compare savings and offer targeted membership benefits. For example:
- “Great! You took four long rides this week; a membership would have saved you $X.”
- “You rode the Lakefront Trail today! Members get discounted e-bike access for long scenic rides.”
Seeing these reminders, they can see concrete and personalized membership benefits that fit their riding style and will save them money. Delivering via push notifications, email, and in-app banners, to trigger automatically when casual riders complete a ride.
Closing
Thank you for reading my case study! As an aspiring data analyst, I’m amazed by how thoughtful data analysis can reveal real opportunities for business growth.
I’m open to feedback, so feel free to leave a comment or share your thoughts.